In one of the previous posts, I had mentioned the techniques we were using to
load test the new API.
Before going dwelling deep into the results, I would like to explain the “Test
Environment” and how the tests were conducted.
Test Environment
The tests were done in a VirtualBox instance running in Windows 7 (64 Bit)
Hardware Specifications
- CPU - Intel Core i5 2410M (Sandy Bridge)
- RAM - 8 GB DDR3-1333
- Graphics Card - Intel HD Graphics
- SSD - Intel 520 Series 240G
VirtualBox Configuration
- Version - 4.3.20 r96997
- Type - BSD (NetBSD 32-Bit)
- Memory - 512 MB
- CPU - 1 Core, PAE/NX, VT-x, Nested Paging
- Display - 9 MB, Remote Display enabled in port 5001
- Storage - IDE Primary Master, 40.00 GB (Dynamically Allocated Storage), VDI Format
- Audio - Disabled
- Network - Adapter 1, NAT, Intel PRO/1000 MT Desktop (82540EM), Cable Connected
- Serial Port - Disabled
- USB - Disabled
- No Shared Folders
NetBSD Details
-
Kernel Build Environment
CYGWIN_NT-6.1 DELTA 2.6.1(0.305/5/3) 2016-12-16 11:55 x86_64 Cygwin
-
Run Environment With uvm_hotplug(9) Enabled
NetBSD theta 7.99.54 NetBSD 7.99.54 (GENERIC_HOTPLUG) #12: Tue Jan 3 16:49:42 IST 2017
-
Run Environment With uvm_hotplug(9) Disabled
NetBSD theta 7.99.54 NetBSD 7.99.54 (GENERIC) #58: Tue Jan 3 16:49:44 IST 2017
Test Methodology
All of the tests in t_uvm_physseg_load where run in both the hotplug enabled
and hotplug disabled environment. The tests were run 100 times each in both
the environment.
The values used in the results section are an average of the 100 runs, we
also show the Minimum and Maximum values. In addition to this we also, ran a
dummy run on the random() function call without the PHYS_TO_VM_PAGE()
translation happening. This was done to find out how much additional time was
taken up by the random() from random(3) library. This number did become
significant for very large values of the looping test as we will see in the
results section.
In order to better understand the performance of the implementations we also
calculated the standard deviation as well as the Margin of Error for the values
for 100M calls to PHYS_TO_VM_PAGE().
The test environments were reset for each of the runs via a fresh reboot of the
VirtualBox instance.
For hotplug enabled instance, the “fragmentation” tests were run in addition to
the regular test suite which was build agnostic to hotplug.
Results
So finally, the much awaited results section
Before presenting with the actual benchmark, I would like to put in the time
consumed by the random(3) function call, in a total of 100 runs, the
random(3) function contributed to roughly 2.03 seconds for the average runtime,
for a 100 Million calls to PHYS_TO_VM_PAGE().
Calls to PHYS_TO_VM_PAGE()
Note: Number after test name indicates the amount of calls done to
PHYS_TO_VM_PAGE()
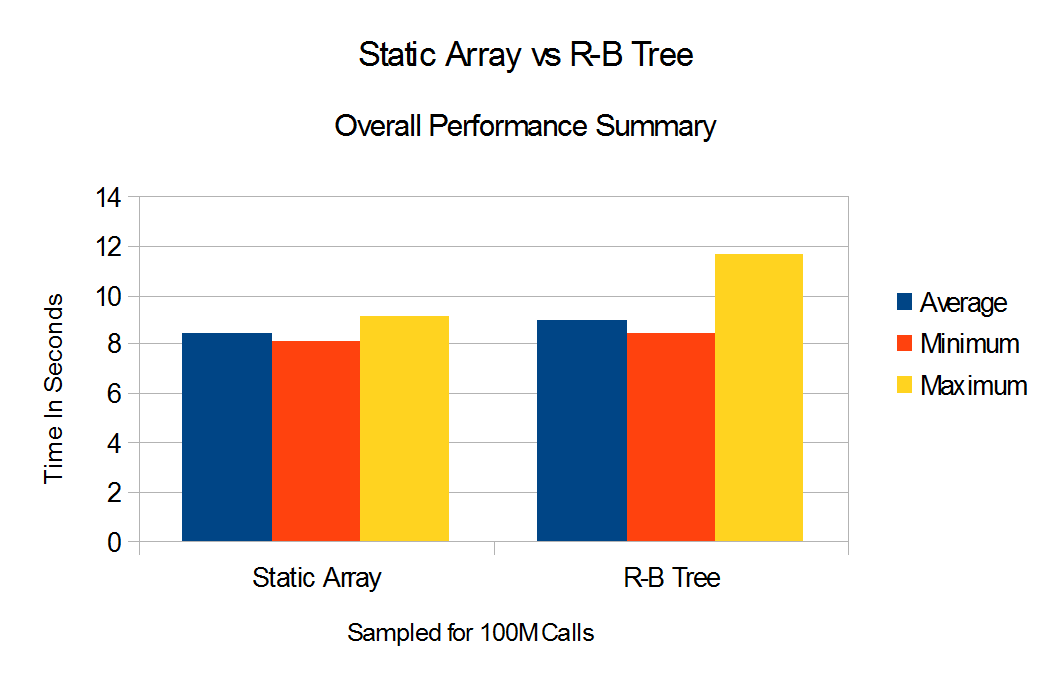
Average, Minimum and Maximum execution times of various load tests with
uvm_hotplug(9) enabled.
|------------------+----------+----------+-----------|
| Test Name        |  Average |  Minimum |   Maximum |
|------------------+----------+----------+-----------|
| uvm_physseg_100  | 0.004599 | 0.003286 |  0.010213 |
| uvm_physseg_1K   | 0.002740 | 0.001991 |  0.005747 |
| uvm_physseg_10K  | 0.003491 | 0.002836 |  0.007941 |
| uvm_physseg_100K | 0.011424 | 0.009388 |  0.017161 |
| uvm_physseg_1M   | 0.093359 | 0.079128 |  0.138379 |
| uvm_physseg_10M  | 0.892827 | 0.813503 |  1.172205 |
| uvm_physseg_100M | 8.932540 | 8.434525 | 11.616543 |
|------------------+----------+----------+-----------|
Average, Minimum and Maximum execution times of various load tests with
uvm_hotplug(9) disabled.
|------------------+----------+----------+----------|
| Test Name | Average | Minimum | Maximum |
|------------------+----------+----------+----------|
| uvm_physseg_100 | 0.004714 | 0.003511 | 0.013895 |
| uvm_physseg_1K | 0.002754 | 0.002088 | 0.005318 |
| uvm_physseg_10K | 0.003585 | 0.002666 | 0.005271 |
| uvm_physseg_100K | 0.011007 | 0.009199 | 0.016627 |
| uvm_physseg_1M | 0.086208 | 0.076989 | 0.116637 |
| uvm_physseg_10M | 0.843048 | 0.782676 | 0.980598 |
| uvm_physseg_100M | 8.434760 | 8.128623 | 9.132065 |
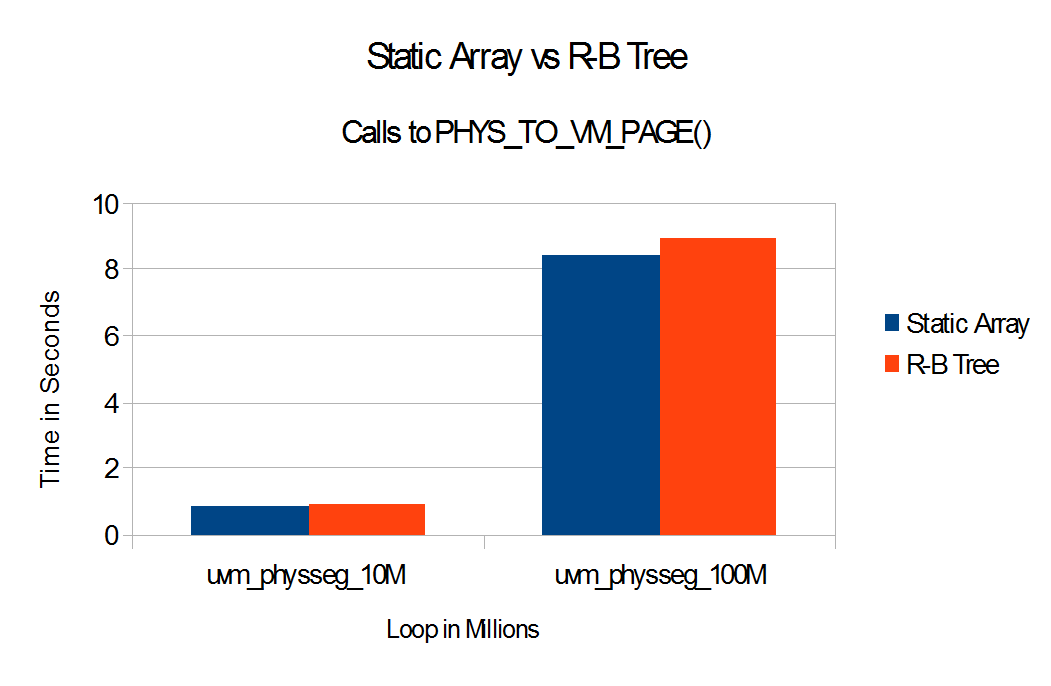
|------------------+----------+----------+----------|For a more visual representation of the above tables. Here is the comparison
between 10M calls and 100M calls to PHYS_TO_VM_PAGE().
Note: Only the 10M and 100M calls are plotted here.
This shows the Average, Standard Deviation and Margin of Error for 100M calls to
PHYS_TO_VM_PAGE().
|--------------------+--------------+-----------|
|                    | Static Array |  R-B Tree |
|--------------------+--------------+-----------|
| Average            |      8.43476 |   8.93254 |
| Standard Deviation |      0.19331 |   0.41553 |
| Margin of Error    |    ± 0.03789 | ± 0.08144 |
|--------------------+--------------+-----------|
This graph gives a more magnified view of how the R-B Tree implementation
compares against the Static Array implementation over 100M calls to
PHYS_TO_VM_PAGE().
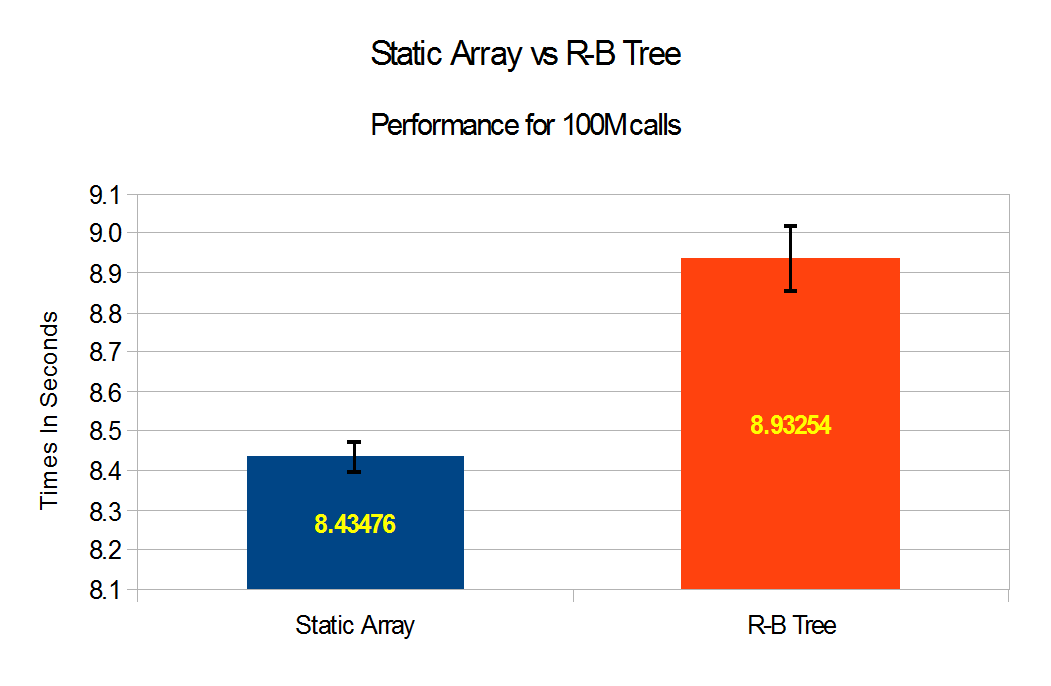
As you can see With the R-B Tree implementation there is a 5.59% degradation
in performance.
Here is a comparison of the Average, Minimum and Maximum times taken 10M and
100M calls to PHYS_TO_VM_PAGE() respectively.
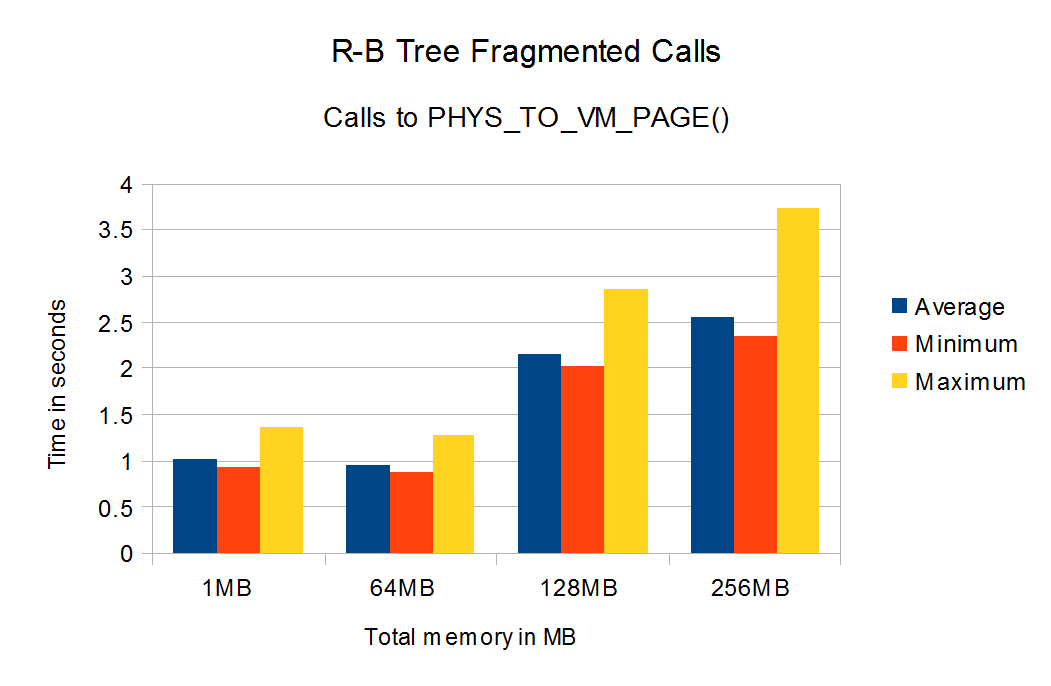
Calls to PHYS_TO_VM_PAGE() after fragmentation
This test can only be done with uvm_hotplug(9) enabled since it required
uvm_physseg_unplug() to be available during the testing.
Note: Number after test name indicates the amount of memory on which
fragmentation was done by uvm_physseg_unplug(), memory was unplugged every 8
Frames starting from PFN 8.
Note: After unplug was completed PHYS_TO_VM_PAGE() was called 10M times for
every test.
|-------------------+----------+----------+----------|
| Test Name         |  Average |  Minimum |  Maximum |
|-------------------+----------+----------+----------|
| uvm_physseg_1MB   | 1.015810 | 0.941942 | 1.361913 |
| uvm_physseg_64MB  | 0.958675 | 0.877151 | 1.279663 |
| uvm_physseg_128MB | 2.155270 | 2.024838 | 2.866540 |
| uvm_physseg_256MB | 2.550920 | 2.360252 | 3.736369 |
|-------------------+----------+----------+----------|
Conclusion
Overall the R-B Tree implementation only suffers slightly by a margin of
5.59% in direct comparison to the Static Array implementation for 100M calls
to PHYS_TO_VM_PAGE(). That being said, the above test could be considered as a
“Synthetic” benchmark and does not depict realworld performance.